Final Project: ICM

Dating Stories: An Interactive Film

For my final ICM project, I decided to combine my PComp and ICM finals to create an interactive, nonlinear film.

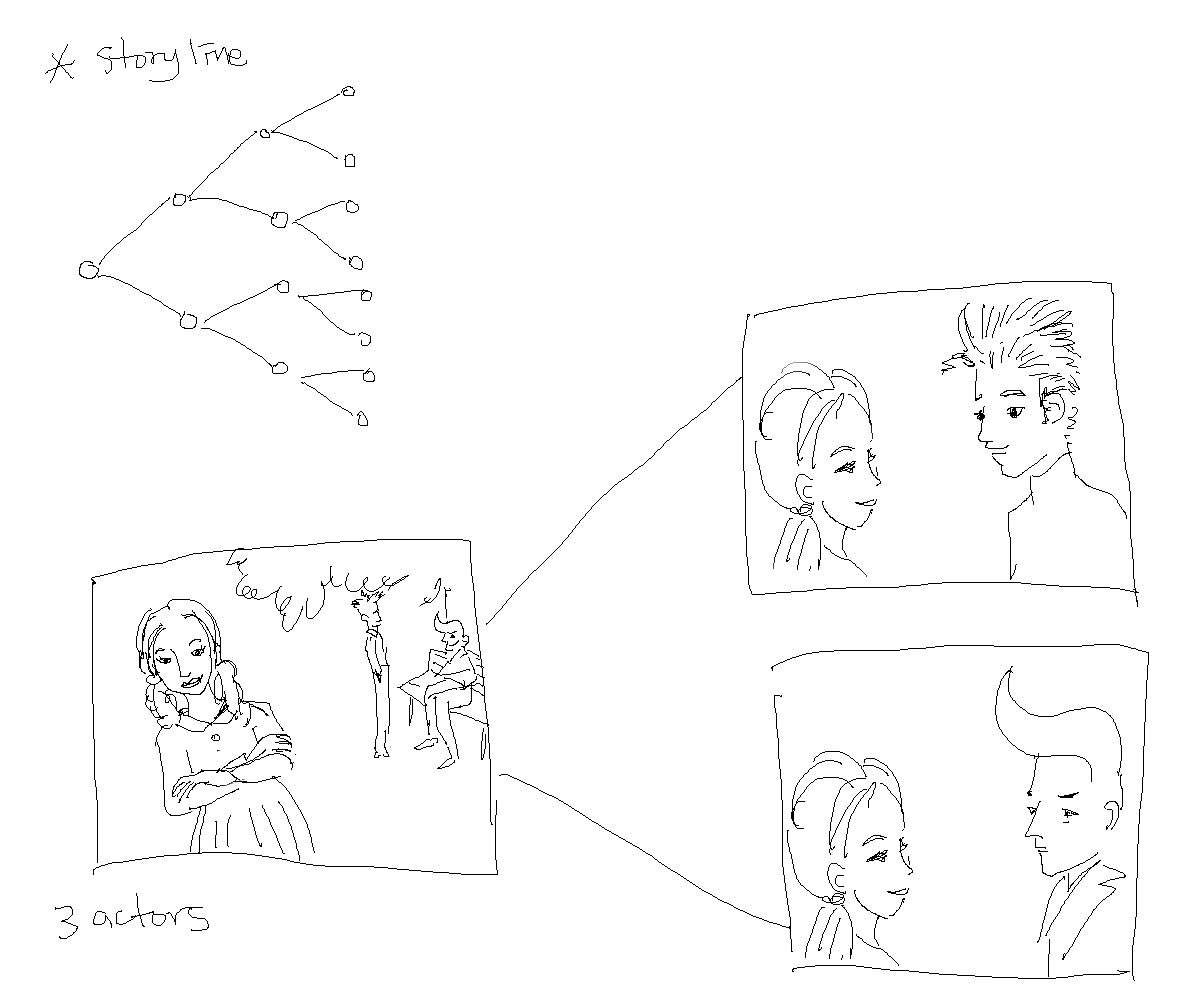
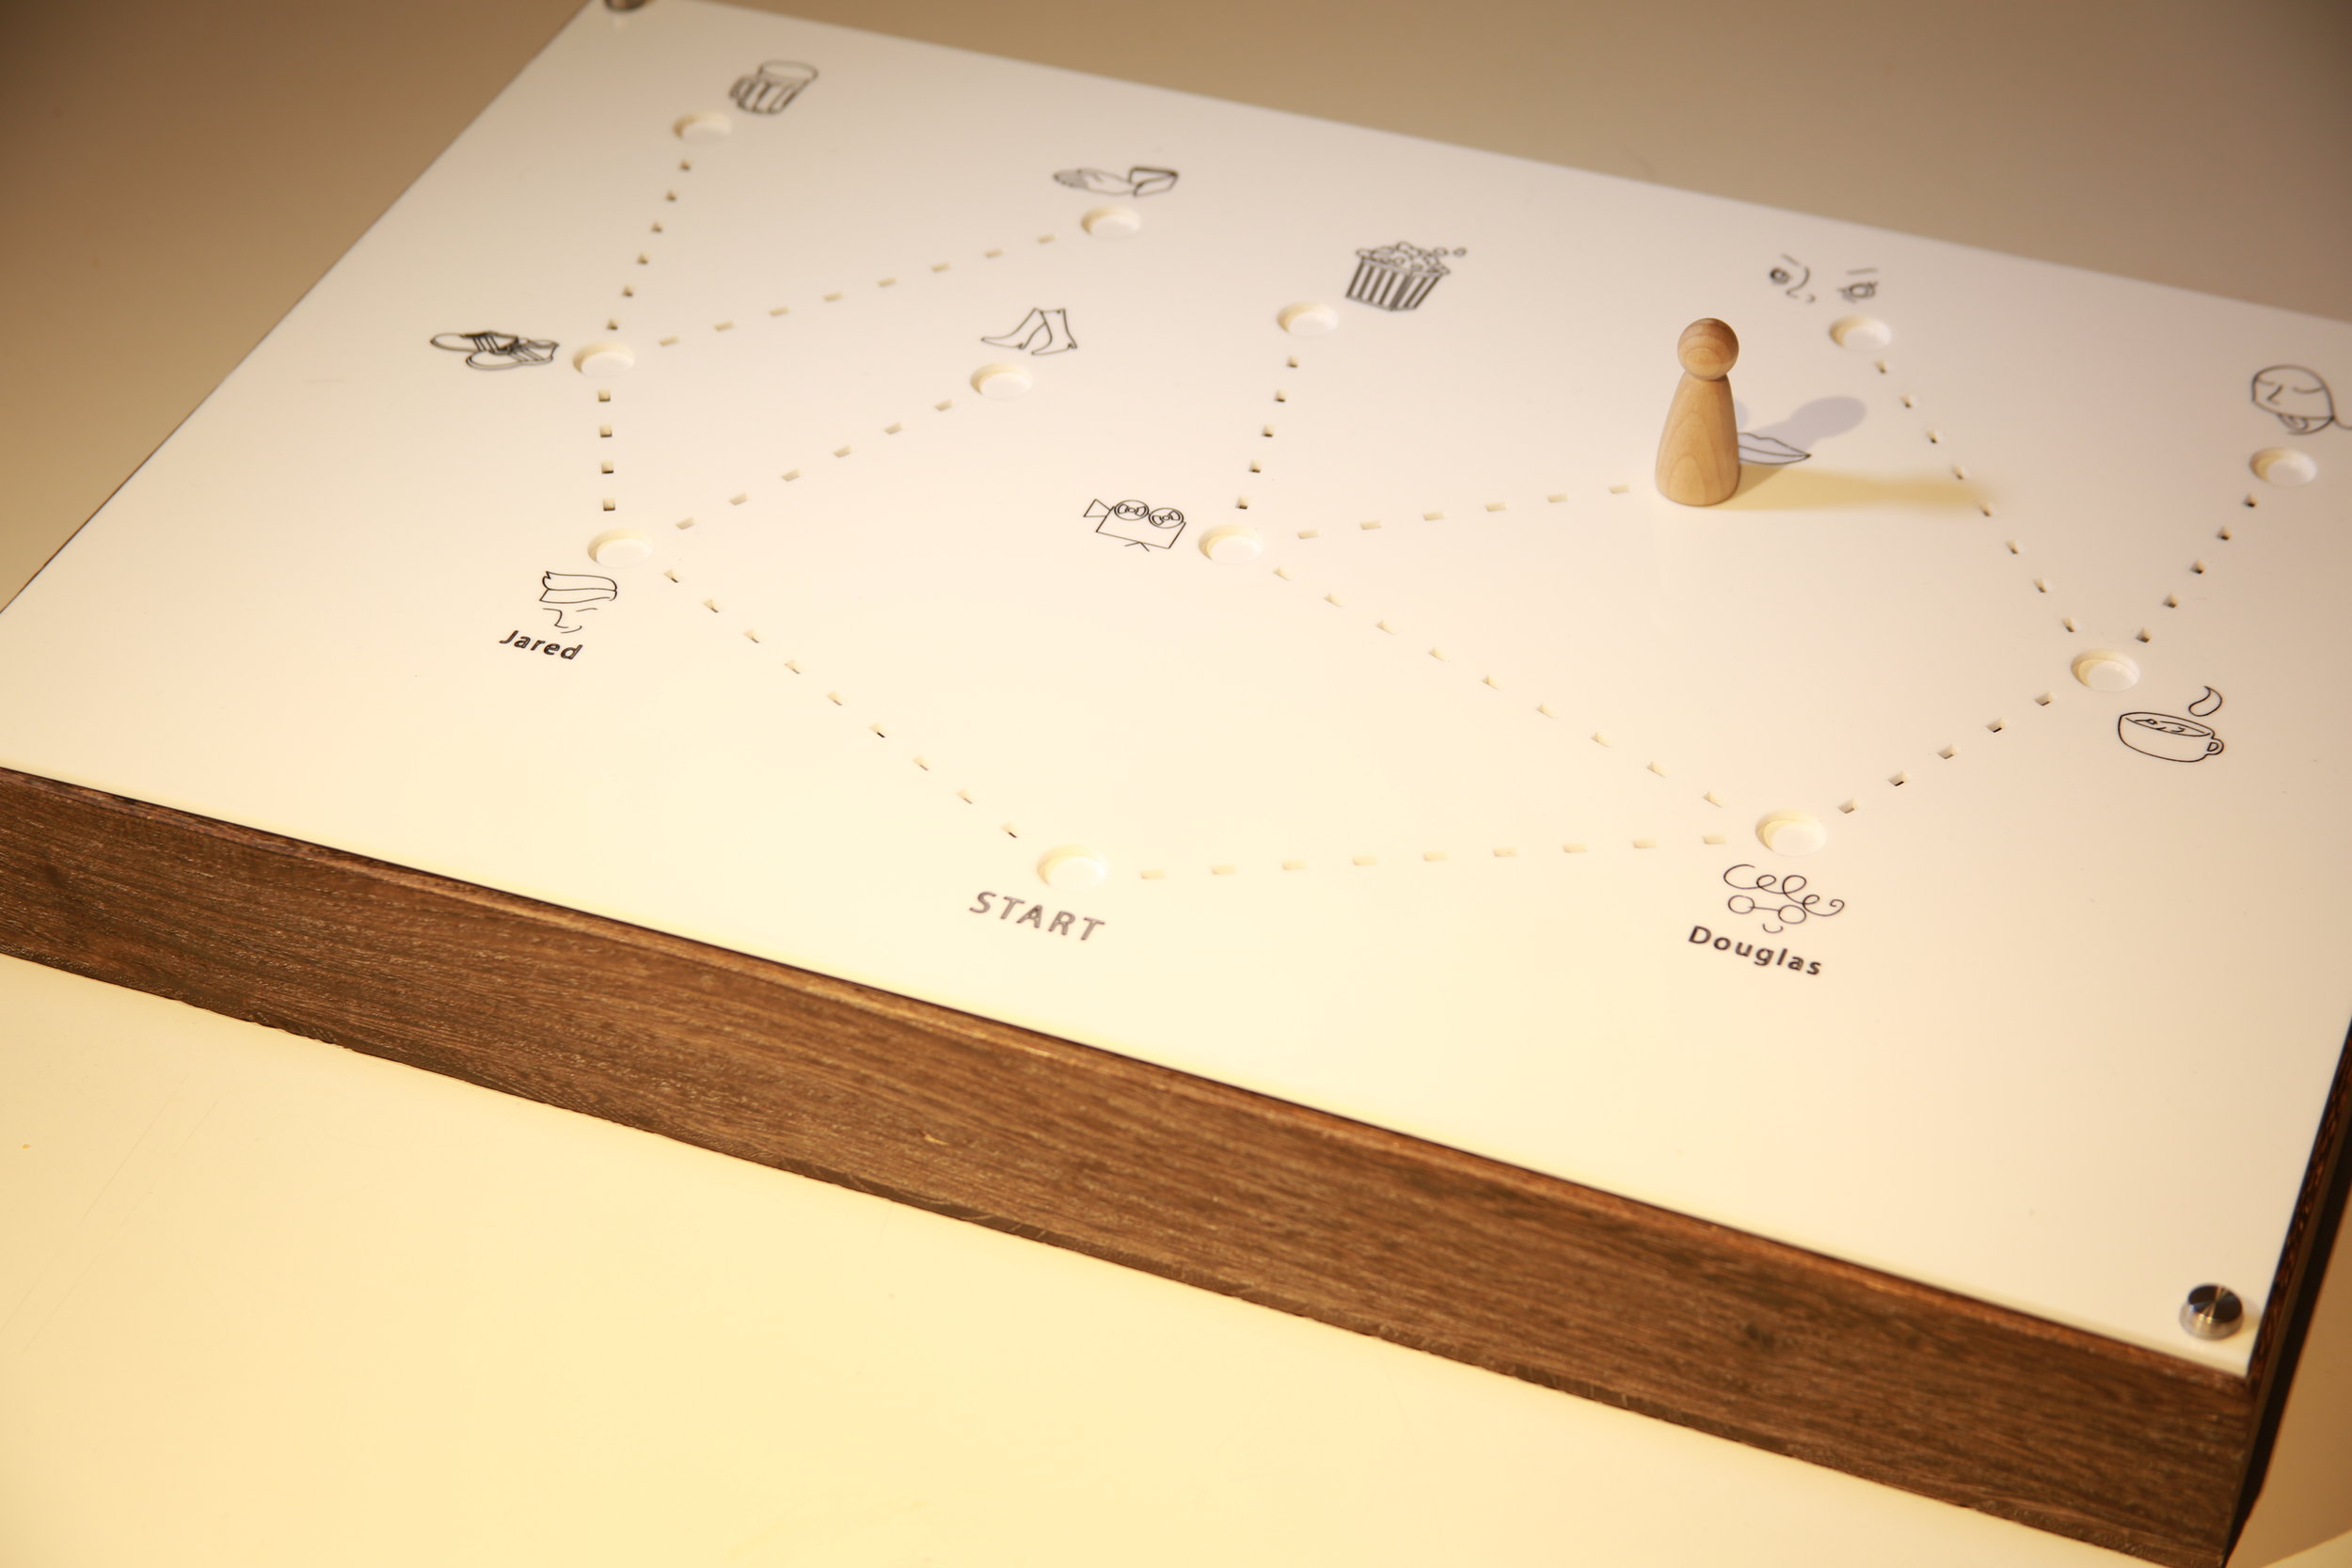
Dating Stories: An Interactive film is a comedic, 'choose your own adventure’-style narrative created for adults. The lead actress in the film, Christine, has two choices from her search on a popular dating app: will she go on a date with Douglas or Jared? Ultimately the individual observer gets to decide. By using the physical, interactive board, the observer has the ability to choose what path the date goes on in the film by moving the wooden piece from node to node. Their choices and full narrative are executed on the screen in p5.js.

Here is what the physical board looks like:

741b0012

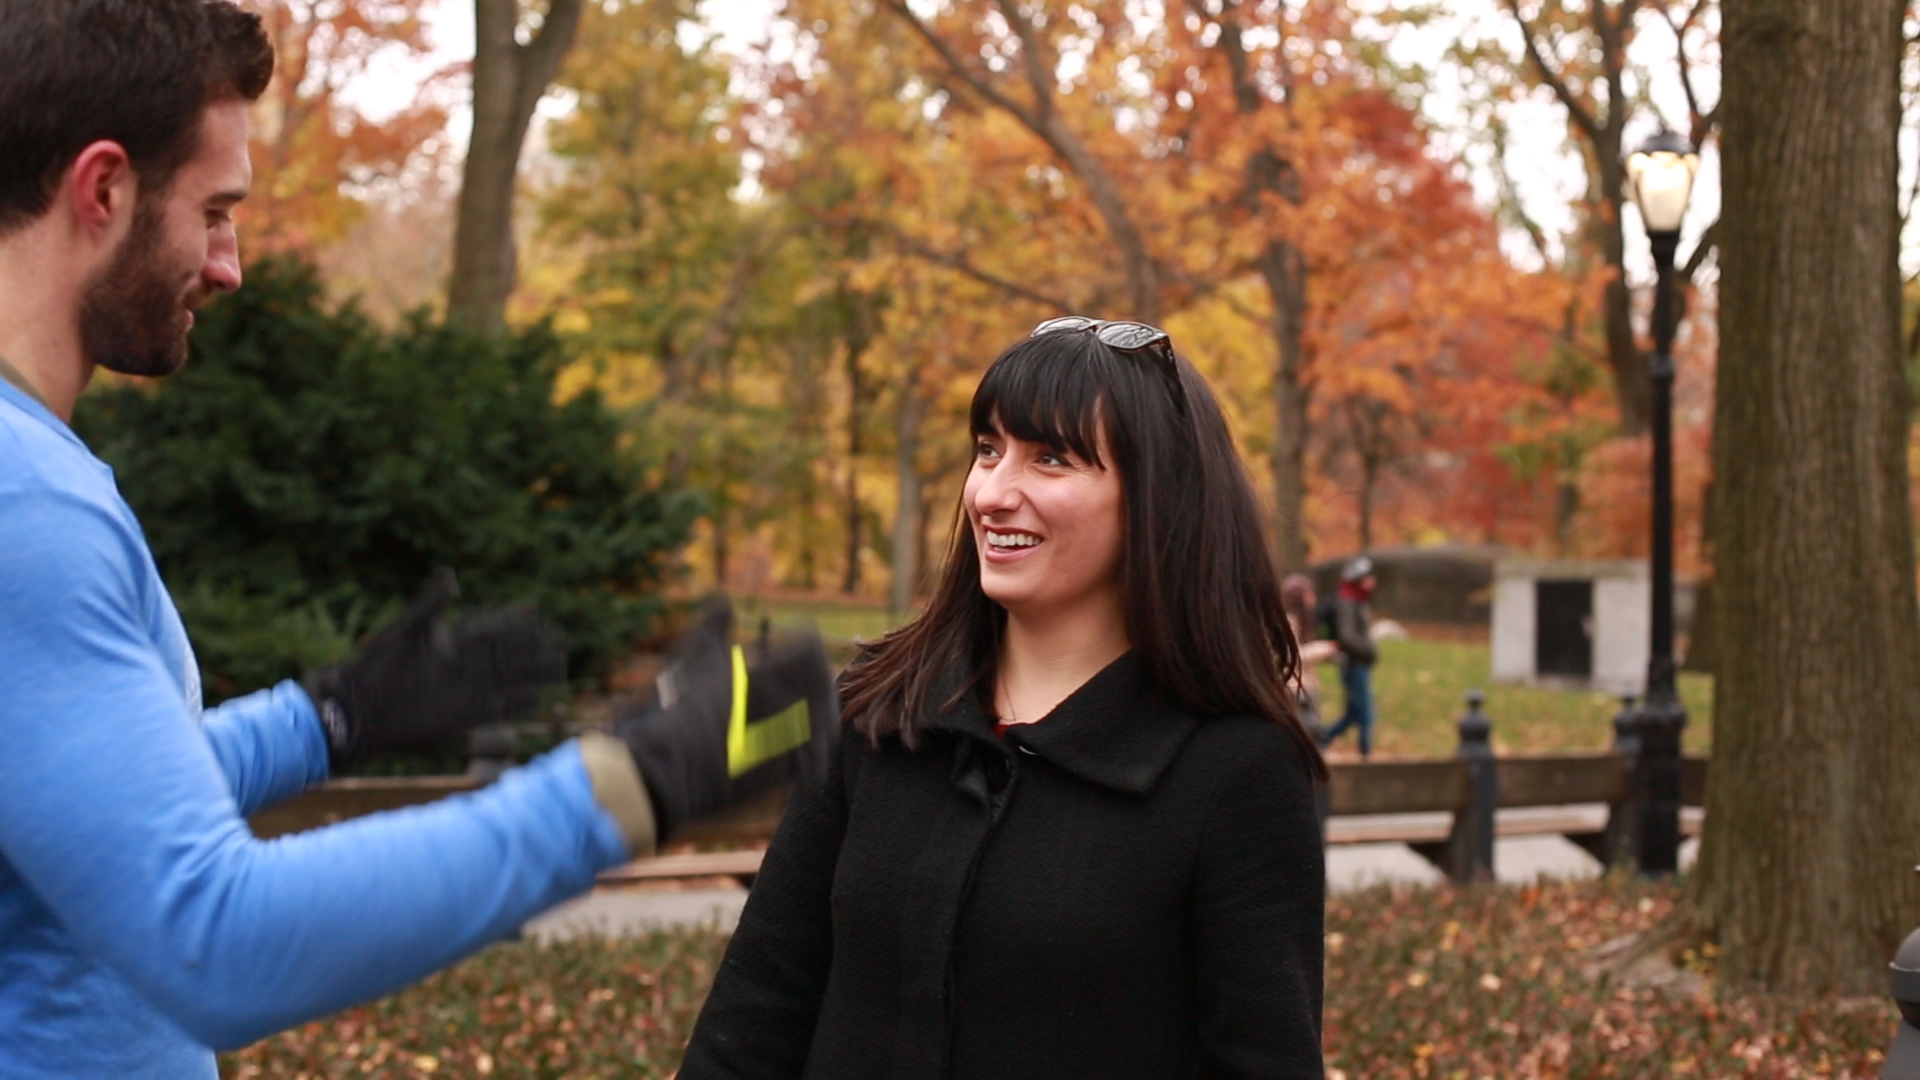
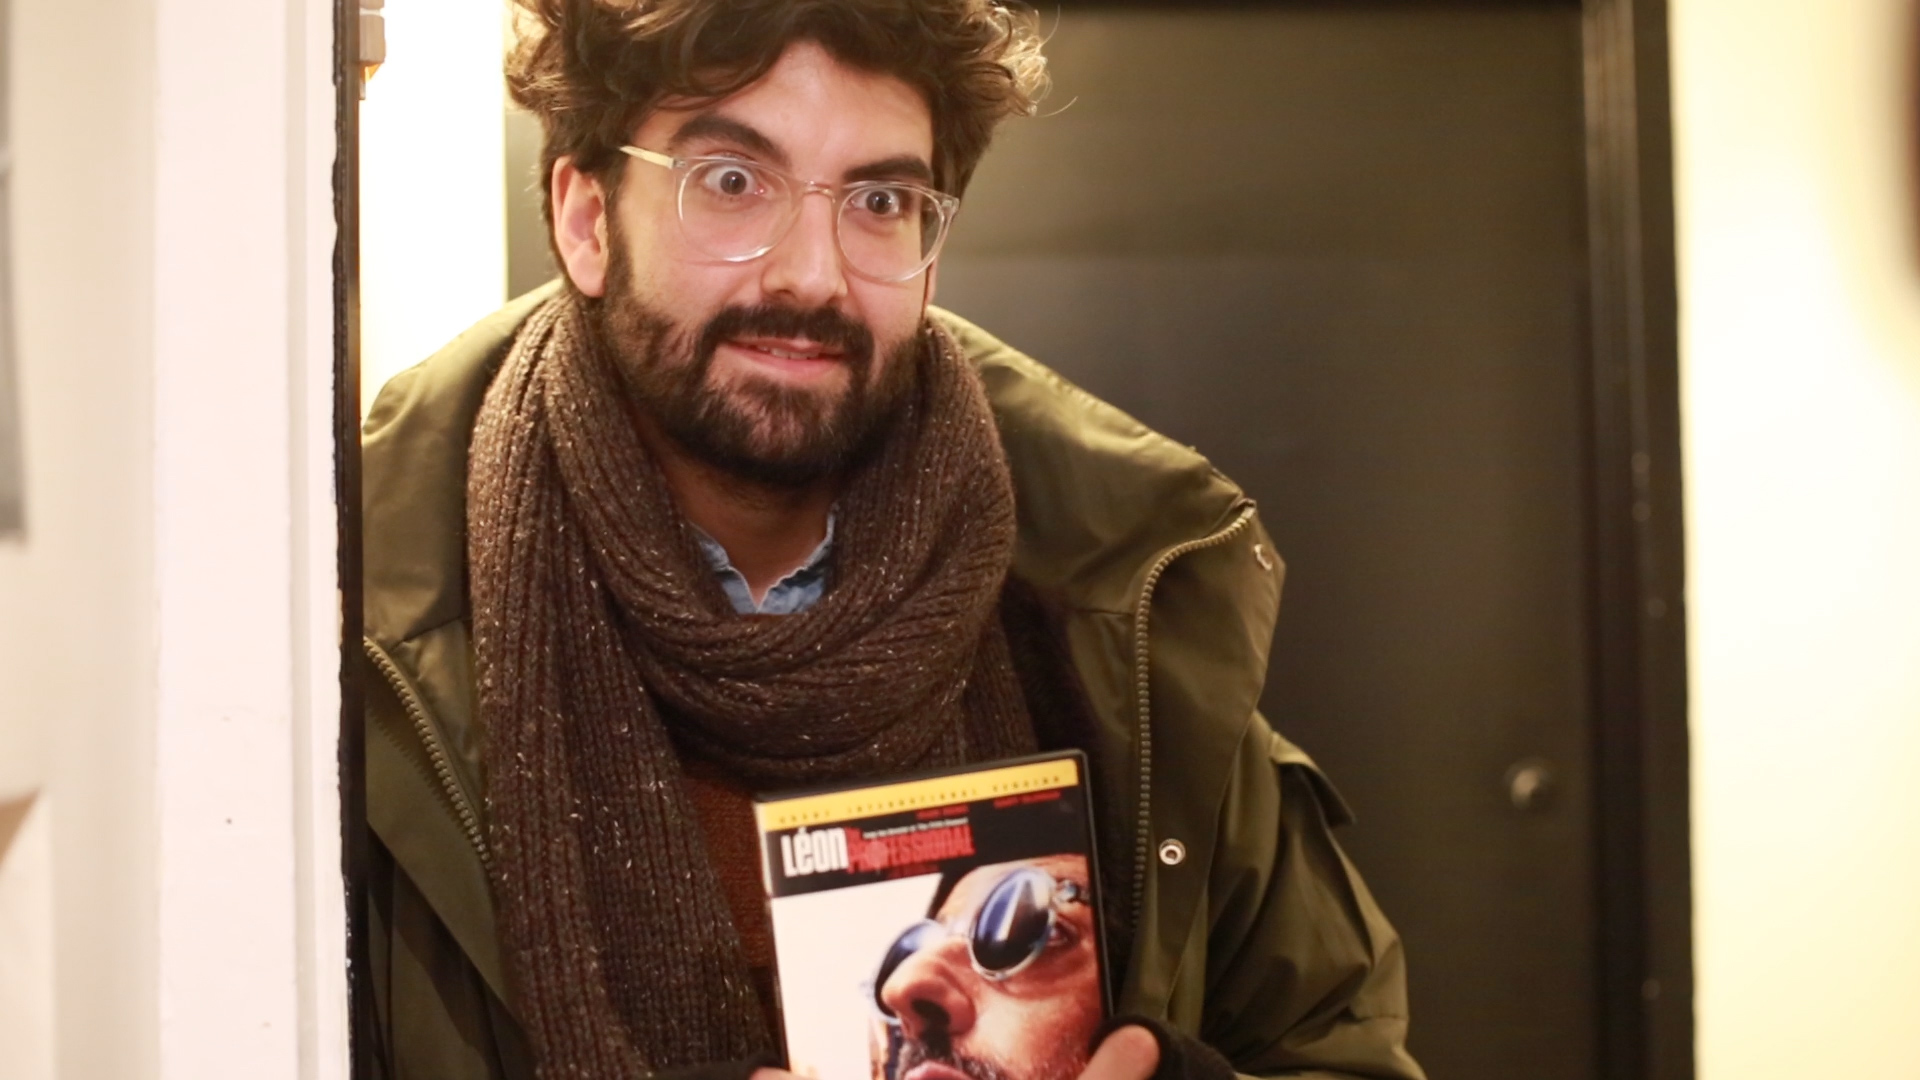
And here are some stills from the film:

1-jared-setup-00_00_40_29-still002 2b2-douglas-movie-good-00_00_27_13-still001

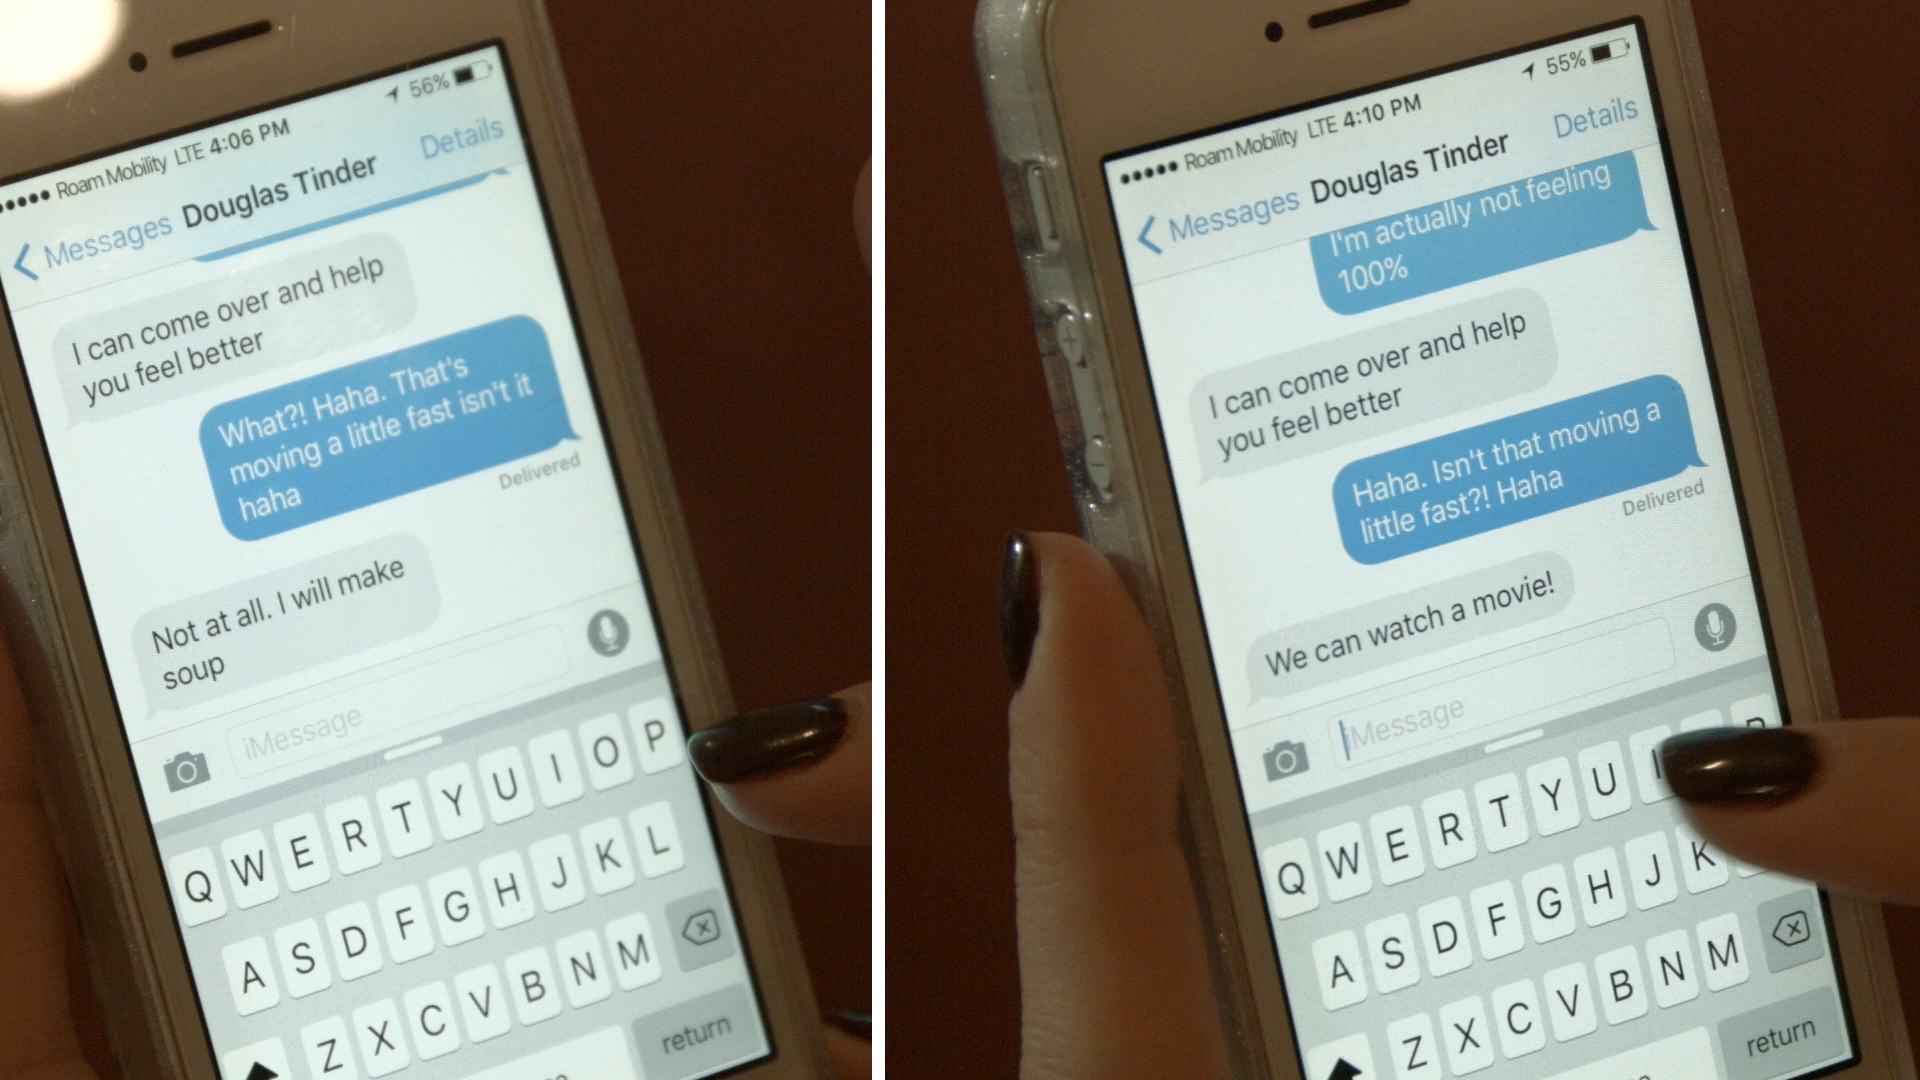
At certain points in the film, the viewer will see a split screen that gives them the opportunity to decide what the direction of the film goes in

s_m_choiceimage

This project comprised of filming the media, fabricating the board, programming the arduino from the physical interactions, and coding the the responsive media in p5.js.

What I learned from this project
  • How to use a development server
  • How to correctly work with the P5 IDE & git
  • How to effectively use the developer console. CMD + OPT + J all day

I really enjoyed having the opportunity to combine my final project for both ICM and Pcomp. Having the opportunity to use the tools form both of these classes really helped to pull this idea together.

I am hosting the p5.js and Arduino code on Github. Here is the location for the Dating Stories code.

Brightness Theremin

Since starting at ITP, I have really enjoyed creating different musical instruments.  In physical computing, I created a theremin and I was excited to try to attempt to create one in p5.js. This past week we were working with sound and video, so I felt like this was an appropriate class to work with webcam input to create a sound.  My sketch is compiled of a oscillating sound that changes the frequency when your hand gets closer to the webcam. The sketch is is ultimately using brightness to change the frequency and the background color.

As your hand gets closer to the webcam, the brightness of your hand increases the frequency. If you completely cover the webcam, allowing no light to pass, the tone stops.

I worked with Shiffman's video about a brightness mirror that detects individual pixel brightness and this sounds oscillator example in the p5.js references to create this sketch.

Here's the sketch.

And here is the code:

var video;

var vScale = 16;

var cols = 48;
var rows = 64;

var osc;
var fft;

function setup() {
 createCanvas(400,400);
 pixelDensity(1);
 video = createCapture(VIDEO);
 //video.hide();
 video.size(cols, rows);
 osc = new p5.Oscillator();
 osc.setType('sine');
 fft = new p5.FFT();
 osc.start();
}

function draw() {
 var bright = 0;
 video.loadPixels();
 for (var y = 0; y < video.height; y++) {
 for (var x = 0; x < video.width; x++) {
 var index = (video.width - x + 1 + (y * video.width)) * 4;
 var r = video.pixels[index + 0];
 var g = video.pixels[index + 1];
 var b = video.pixels[index + 2];
 if (r && b && g) {
 bright += ((r + g + b) / 3);
 }
 }
 }

 bright /= (cols * rows);
 background(bright/2, bright, 255 * log(bright));
 osc.freq(bright * 3);

var waveform = fft.waveform(); // analyze the waveform
 beginShape();
 strokeWeight(3);
 for (var i = 0; i < waveform.length; i+=100) {
 var w = map(i, 0, waveform.length, 0, width);
 var z = map(waveform[i], -1, 1, height, 0);
 vertex(w, z);
 ellipse(w, z, 20);
 }
 endShape();
}

Data Visualization

Using the tools we have already learned, we were asked to create a data visualization from sources data either from previously collected data or from an API. A topic that I'm particularly interested is climate change. With that in mind, I wanted to incorporate a visual in my project that depicted the rise of CO2 in the atmosphere.

I initially started working with tabular dataset, and quickly decided that it try to move to data that would be easier to work with.  I found a resource that sources JSON data and everything came together nicely after that ;).

Here is the very simple sketch that I create for this concept.


DOM elements in p5.js

For this assignment we were asked to create an interactive page in p5.js using p5.js dom elements. I had a lot of fun creating and playing around with these elements, but I ran into a fair amount of issues when trying to implement different ideas.

Initially, I wanted to create a photobooth where you could apply filters to the createCapture() of the video and then save that photo somewhere on the screen. I ran into a lot of problems trying to implement this. What I believe the issue was is that I am applying the filters on the canvas and since the canvas is occupied, I am not able to print them below. Would I need to have a second canvas if that's the case?

The other issue that I ran into was not know exactly when to add styles to javascript, when to add them to the html, and when to add them to the css section.  I feel like I did it wrong since I created all the elements in javascript, i couldn't have them all in one div.  Thus mass selection on the page to move them to the center became this huge task.  With that said, I'm still not sure how to navigate where each element should be created and what place would be the best to style those elements.

I don't feel like this is a finished project as I spend a lot of time just trying to get it to work, but I did learn a tone in the process :).

Here is the that I am calling instacopy.